UML Unplugged: An Entertaining Expedition through Software Visuals!
- Arany Mák

- Apr 28, 2025
- 4 min read
Updated: Nov 8, 2025
Today, we're diving into the wonderful world of the Unified Modeling Language (UML), the visual language that gives us the power to construct, document, and visualize our software systems. Now, I know what you're thinking - "visual language" sounds like UML might be drawing silly stick figures, but trust me, it's way cooler than that!

So, how does this magical UML thing work?
Let me break it down for you, but fear not, no complicated algorithms or rocket science jargon involved!
First up, we've got the star of the show - OBJECTS. They're the real-world entities that form the foundation of UML. Think of them as the building blocks of our software universe - without them, we'd be lost in the coding abyss!
Next up, we've got CLASS - the software world's way of defining an object's structure and function. You can imagine classes as those neatly organized containers where all the magic happens. Want to know how your code works? Check the class!
Now, let's talk ABSTRACTION. This is where UML gets a little philosophical. Abstraction visualizes how objects behave and depend on other elements of the diagram. It's like the zen of coding - understanding the essence without worrying about the details.
Oh, we can't forget about INHERITANCE - the technical process of categorizing classes of objects or creating new ones from the existing ones. It's like giving your code a family tree - who knew programming could have so many cousins!
And here comes ENCAPSULATION - the fancy way of saying "keeping secrets." It's like wrapping your data in a protective bubble, shielding it from those who shouldn't mess with it. You know, because some people just can't resist poking their noses where they don't belong!
Now, brace yourself for POLYMORPHISM - where entities or functions take on different shapes at different times during development. It's like your code is having a disguise party!
UML was brought to life in 1995 by the trio of Grady Booch, Ivar Jacobson, and James Rumbaugh. They must have had a real coding blast! In 1997, UML got adopted by the cool kids at the Object Management Group, including tech giants like Hewlett-Packard, Apple, and IBM. It's like UML became the hottest software trend, and everyone wanted a piece of the action!
Then, in 2005, the International Organization for Standardization (ISO) standardized UML. Talk about making it official! Since then, UML has been going through revisions and reviews, like a software rockstar constantly reinventing itself. The latest UML spec rolled out in 2015, keeping the party going strong!

Alright, now let's check out the TYPES of UML diagrams, shall we?
Hold on tight, we're about to navigate through the fun and games of software visualization!
First, we have the STRUCTURAL diagrams. These are the blueprints of our software world, showing how everything fits together like pieces of a puzzle. Class diagrams are the MVPs here, depicting classes and their relationships - it's like the high school yearbook of your software!

COMPONENT diagrams come next, like the organizational chart of your software army. Composite structure diagrams are like X-ray vision, revealing how classes talk to each other internally. Who knew coding could be so revealing?

DEPLOYMENT diagrams take us on a hardware adventure, showing us which software components run efficiently on which hardware buddies. It's like matchmaking for your code and machines!

Don't worry, we haven't forgotten the OBJECT diagrams! They're like the gossip queens of the UML world, spilling all the details about relationships and characteristics. Oh, the drama!
Next up, we have the BEHAVIORAL diagrams - the how-to guides for proper software functioning. Use case diagrams are like flowcharts for your code's adventures, showing how everything connects and interacts. It's like planning a grand adventure for your software superheroes!

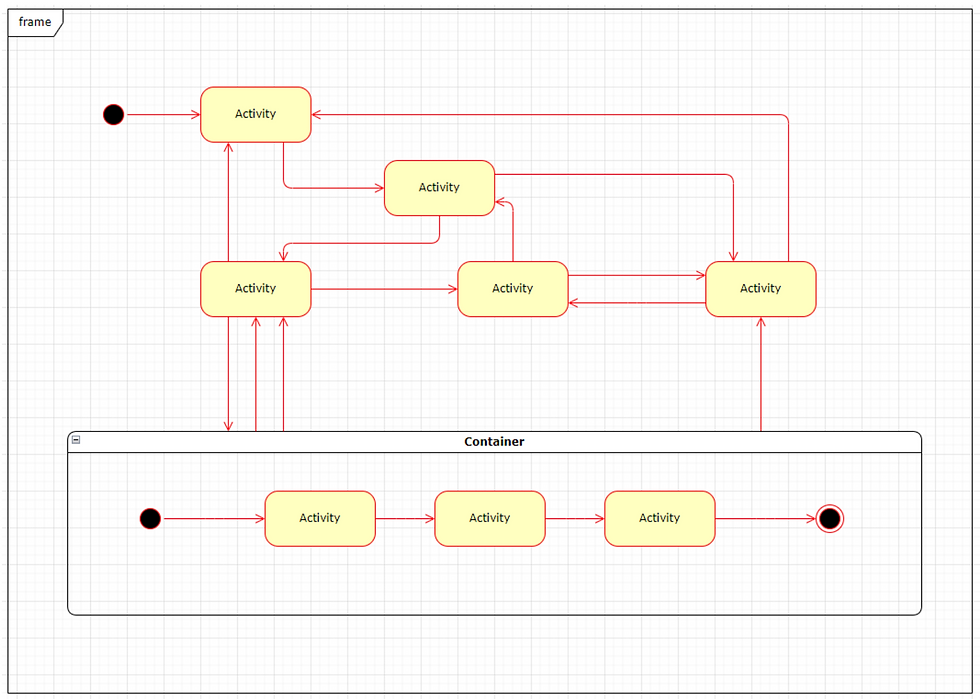
ACTIVITY diagrams are like dance routines for your code, showcasing the flow of control in a system. Think of it as the choreography of your software show - graceful moves and smooth transitions!

The SEQUENCE diagram is where your code's communication skills shine, showing how objects talk to each other one step at a time. It's like a perfectly orchestrated symphony of code conversations!

Now, let's not forget the COMMUNICATION diagrams! They're like the gossip columns of the UML world, exposing the sequential exchange of messages between objects. Who said coding couldn't be dramatic?

And then, we have the STATE MACHINE diagrams - the chameleons of UML. They show how objects behave differently in different states. It's like coding magic - now you see it, now you don't!
Lastly, the TIME diagram is like a time-traveling sequence diagram, showing how objects behave over time. It's like your code gets its own time machine - what a trip!
So, there you have it - the hilarious yet professional guide to UML and its delightful diagrams! Now, armed with this knowledge, you're ready to conquer the software universe and code like a boss.
Happy coding, my fellow tech wizards!


Comments